The coronavirus pandemic has pushed thousands of public companies worldwide into a working capital crisis with constrained cash flow and diminished liquidity. Despite governments providing capital support through loans and grants, companies are still defaulting and filing for bankruptcy. Many corporations were already heavily leveraged before the crisis, so the current business disruptions and financial market turmoil have only aggravated their already precarious financial positioning.
Credit and supply chain professionals should not only rely upon traditional methods of evaluating counterparty risk, including payment performance and financial statement analysis, when investigating public companies. Using these data sources is akin to distracted driving during rush hour traffic. Being on your phone would make you unaware of the tractor-trailer merging into your lane. The outcome would be a devastating wreck, which is why professionals are seeking out the most timely and accurate solutions to monitor financial risk.
The FRISK® Difference
Below we compare the recent readings of the 96% accurate FRISK® score with:
- The DBT Index (analogous to Dun & Bradstreet’s payment based score, PAYDEX® score)
- The Altman Z’’-Score (a well respected and reviewed financial ratio based score)
The disparity between these risk analytics since the onset of COVID-19 is absolutely staggering and demonstrates why companies from more than 35% of the Fortune 1000 rely upon the FRISK® score to protect against public counterparty bankruptcy risks. Simply put, the FRISK® score has consistently provided more reliable and timely risk assessments because it is a nonlinear hybrid score with 4 distinct input categories that mitigate each other’s shortcomings.
The FRISK® score’s daily updates are driven by the inclusion of stock market performance and proprietary subscriber crowdsourcing. Stock market data captures bankruptcy risk through the measure of price volatility, market capitalization, and leverage. Crowdsourcing captures the anonymous aggregated research behaviors of our subscribers on individual counterparties through our web platform. Our research has proven that certain more granular interaction patterns are indicative of increased bankruptcy risk.
Let us examine why payment and financial scores are falling short in the current environment.
FRISK® score vs DBT Index (Payment History)
Public companies work hard to maintain timely payments to their suppliers, vendors, and third parties because credit bureaus evaluate payment trends to derive credit scores and ratings. CFOs, as part of their job function, need to ensure that their suppliers keep shipping on the best credit terms possible in order to support cash flow. Public corporations have access to capital markets and can access various forms of financing, including commercial paper, bonds, and stock, among others. With so many different avenues of capital available, public companies rarely have any issue paying their vendors promptly and thereby mask financial stress leading all the way up to a bankruptcy filing – commonly known as the “Cloaking Effect.”
Risk professionals were blindsided by the Cloaking Effect during the aftermath of the Global Financial Crisis as many companies paid on time all the way to bankruptcy. A similar development is transpiring once again during this COVID-19 Credit Crisis with payment trends failing to provide any measurable indication of increased financial risk. In the chart below, company FRISK® scores are juxtaposed against the DBT Index (i.e. payment trends).
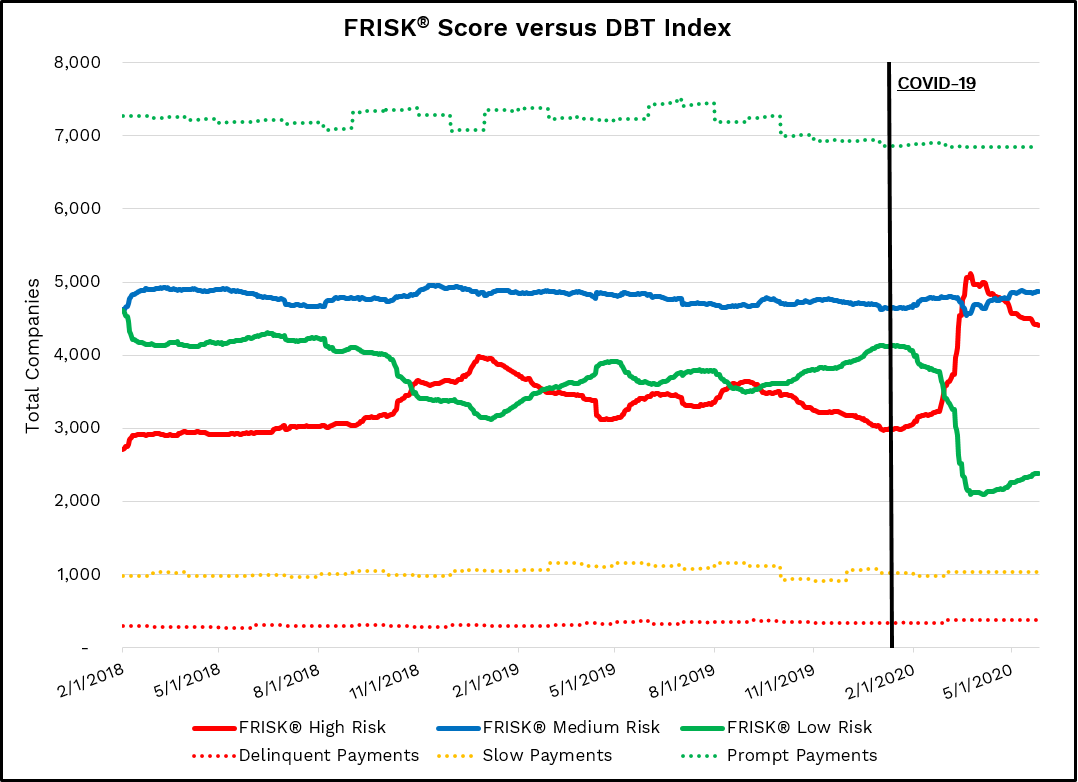
Notice that all three payment categories (dotted lines) provided no indication of risks associated with the pandemic and remain relatively unchanged since February 2020, when the coronavirus hit markets in full force.
It’s also important to note that, in addition to not being informative for public companies, trade payment based scores will lag current risk regimes by at least one-to-two months given:
- Companies need to close out their monthly receivable reports,
- Those data files then need to be submitted to the bureaus for processing, and
- The bureaus need to aggregate the trade prior to running a scoring model
For example, June trade files would not be reported on by a bureau until August or September.
Conversely, the FRISK® score has captured significant increases in financial risk across the board. Total high-risk companies (solid RED line) increased from about 3,000 to more than 5,000 in a few short months. At the same time, low-risk companies (solid green line) dropped from 4,000+ to around 2,000. Payment history, by contrast, shows very little change, indicating it simply failed to warn. For these reasons, payment data is not used in the computation of the FRISK® score. After performing a bankruptcy trend analysis, CreditRiskMonitor determined that bankruptcy filings escalated during the first quarter of 2020 and are likely to remain at an elevated rate throughout 2020 and 2021. In a recent Washington Post article, Dr. Altman, a corporate bankruptcy expert, stated that he “expected a record number of mega-bankruptcies this year, surpassing the previous high of 49 in 2009 for companies with liabilities greater than $1 billion. Defaults on junk bonds also will spike. It’s not only the impact of COVID-19, which is of course the primary reason, but also the enormous amount of debt that had been building up in the economy prior to it.”
It is important to point out that the FRISK® score does in fact include financial data as one of its inputs and this comparison shows the power of a hybrid score. As mentioned earlier, the FRISK® has four inputs that mitigate each other’s shortcomings and we clearly see the shortcoming of lagging financial data. Once again, the inclusion of stock market data and crowdsourcing have mitigated the issues associated with financials and allows the FRISK® score to be computed daily and provide a point in time assessment of risk.
FRISK® score vs Altman Z’’-Score
Financial statement analysis has long been seen as the gold standard in the credit industry given the accuracy and details of filings. Unfortunately, financial statements are only available on a quarterly basis which means that there is a three month lag between updates. A lot can change in three months, so is a score with only four (4) data points per year sufficient in these high volatility times? For certain international companies, the data may be even older, as some foreign filers only report on a semiannual basis. U.S. public companies have reported first quarter results, but the second quarter is where most of the financial damage from COVID-19 is expected to materialize. In other words, the Altman Z’’-Score or an equivalent financial model that only uses financial statements as inputs will inherently lag, just like payment based trends. For context, the Altman Z’’-Score calculation measures profitability, leverage, liquidity, and solvency through specific financial ratios to predict the likelihood of bankruptcy. In the chart below, company FRISK® scores and Altman Z’’-Scores are compared.
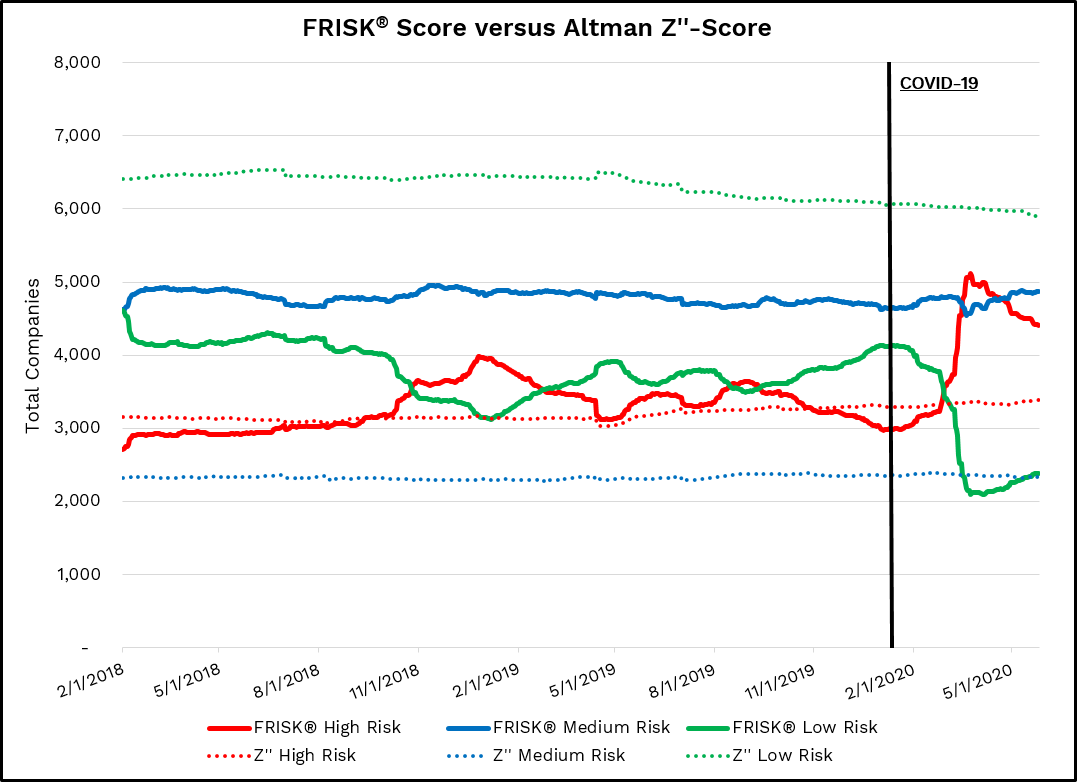
While Altman Z’’-Scores highlight a slight increase in financial risk since February, it was only reflected in less than 3% of the companies. The FRISK® score, in comparison, revealed dramatic changes in risk profiles. From a risk distribution perspective, the Altman Z’’-Score is only identifying about 3,400 companies as high financial risk, whereas the FRISK® score places about 4,400 companies into this high distressed category – meaning the Altman Z"-Score is inappropriately identifying the risk level in nearly 25% of these companies as moderate or even low risk. The risk distribution in these companies is also significant across all three categories:
FRISK® Score | Z"-Score | Risk Delta | |
Low Risk | 20.9% | 50.8% | 29.9% |
Medium Risk | 42.0% | 20.1% | 21.9% |
High Risk | 37.2% | 29.1% | 8.1% |
Companies with low or medium risk based on the Altman Z’’-Score could have significantly higher bankruptcy risk as identified by the FRISK® score. More broadly, the FRISK® score’s daily recalculation frequency offers significantly more opportunities to timely identify distressed counterparties as compared to the majority of other credit models. This, in turn, allows better-prioritized workflow to allocate precious time and resources to the situations that are most likely to have the biggest impact on your company.
Bottom Line
During a period of skyrocketing defaults and bankruptcy filings, leveraging the right credit solutions has never been more important. Rather than waiting for scores and ratings that use payments or financial statements alone to catch up to what is going on in real time, risk professionals should rely upon the daily calculations provided by the FRISK® score. With such a widespread deterioration in company solvency, credit and supply chain professionals need to evaluate their commercial counterparties with more regularity and thoroughness. Expand upon your existing processes by examining financial risk trends by industry with our COVID-19 Credit Crisis resource.