Credit professionals use CreditRiskMonitor®’s Trade Contributor Program to gain quality, real-time insights into their accounts receivable portfolio. We collect ~$3 trillion in trade data annually from our trade providers. After processing this data, we work with credit professionals to be more proactive and tactical with their accounts receivable to make healthier business decisions.
Our priority is to make sure businesses avoid catastrophic financial loss due to bankruptcy. Although both private and public companies go bankrupt, there is generally more to worry about with the latter. The average receivable portfolio typically has approximately 53% of risk exposure to public companies, and dollars are often concentrated in public companies given transactions are larger. We also provide other information on trade payments, which can be utilized to improve cash collections.
This free of charge CreditRiskMonitor® program offers deep evaluation of portfolio receivables at risk and payment performance and we strongly suggest subscribers take advantage of Trade Contributor Program to ensure optimal data analysis on companies within our worldwide database.
Risk Stratification
Successful credit professionals keep vigilant watch on their largest risks to avoid unnecessary exposure. In the graphics below, customer receivables are spread among the FRISK® score, PAYCE® score and DBT Index. All of this information is available to trade contributors.
When receivables are stratified across our predictive models – including the 96% accurate FRISK® score on U.S. public companies and 80% accurate PAYCE® score on private companies – users can see a very clear picture of where risk lies within their portfolio. Both of these models are based on a "1" (highest risk)-to-"10" (lowest risk) scale and have a forward looking 12-month time horizon. Much to the benefit of our subscribers, we are always looking ahead to identify hidden risk.
For instance, nearly 14% of this consolidated receivable portfolio falls into the high-risk category, as shown below:
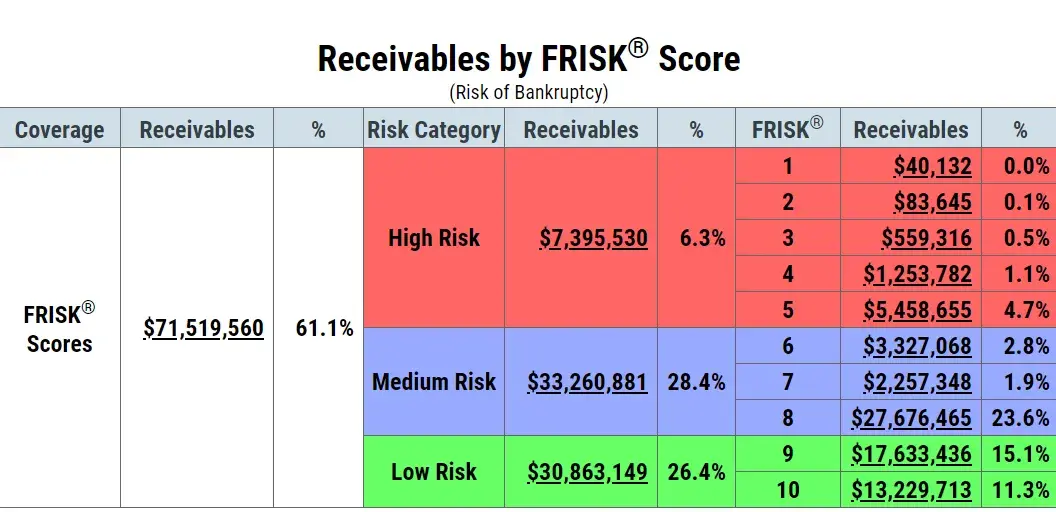
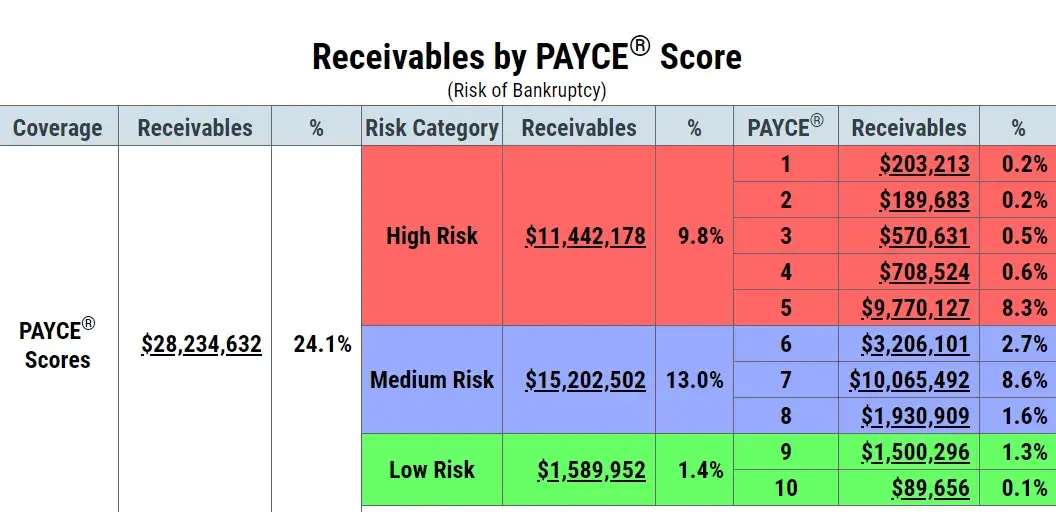
The color-coded categorizations will save time with identifying risk. Within each model’s “red zone,” the “1” to “5” category range indicates where receivables are matched to companies that are financially distressed, with elevated bankruptcy risk. These are the companies that need your immediate attention. Armed with this knowledge, trade contributors are better enlightened and empowered to dive into the details of these receivables at risk.
The flip side of the coin is historical payment performance. CreditRiskMonitor®’s Days Beyond Terms (DBT) Index displays whether a company has been paying its invoices on time. It is a backward-looking, dollar-weighted measurement of past payment performance, converted into a simple range labeled from "1" (worst) to "10" (best). As you can see below, the DBT Index shows that a small dollar amount of receivables are delinquent:
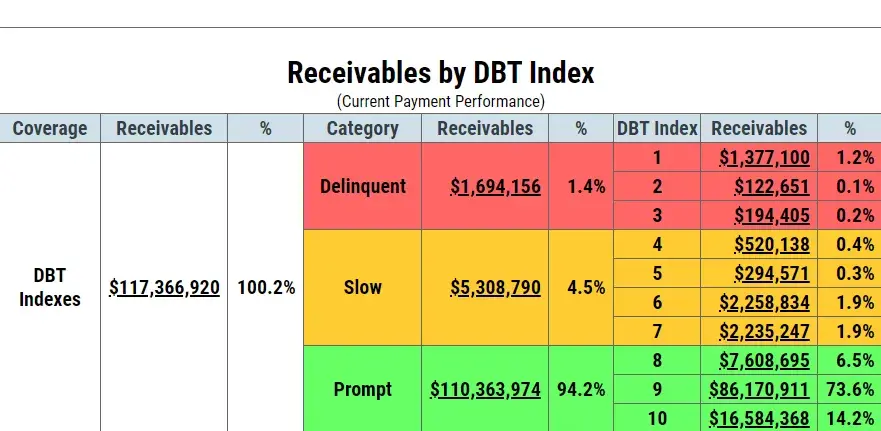
One may consider this as good news given that past payment performance is often used as an indication of future performance. However it is important to understand that the DBT Index is not reliable for future bankruptcy risk assessment. Payment performance will only reveal that 2% of receivables are delinquent in the average receivable portfolio. The FRISK® score and PAYCE® score stratification, meanwhile, shows that approximately 16% of receivables are high risk. There is a massive disconnect between perceived risk (2%) and actual risk (16%). Don’t let this hidden problem effect your company.
Trade contributors are strongly advised to monitor all three of these measures carefully; further, they must be able to identify the unique value of each of the scores when making intelligent credit decisions. Putting it all together, the FRISK® score and PAYCE® score will help you identify how likely a particular company is to fail or file for bankruptcy, while the DBT Index allows you to gauge your historical payment performance (answering the question: "Has this company been paying invoices in a timely manner?").
Managing Slow Payers
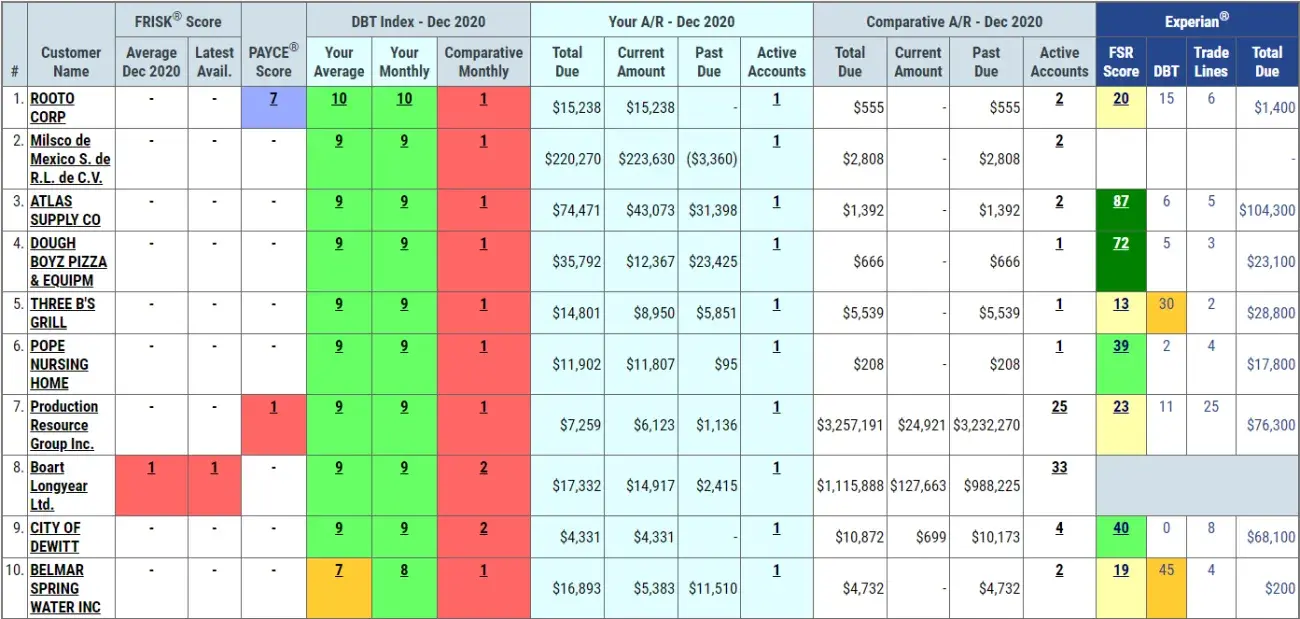
CreditRiskMonitor® offers more reports to trade contributors beyond the ones mentioned above. The Slow Payers report highlights which customers are paying you slowly, and how quickly each company is paying other trade contributors. In the sample report shown below, be keen to note the contrast between “your monthly” DBT Index versus “comparative monthly” DBT Index. Effectively, this report will provide information you can leverage to manage your collections better.
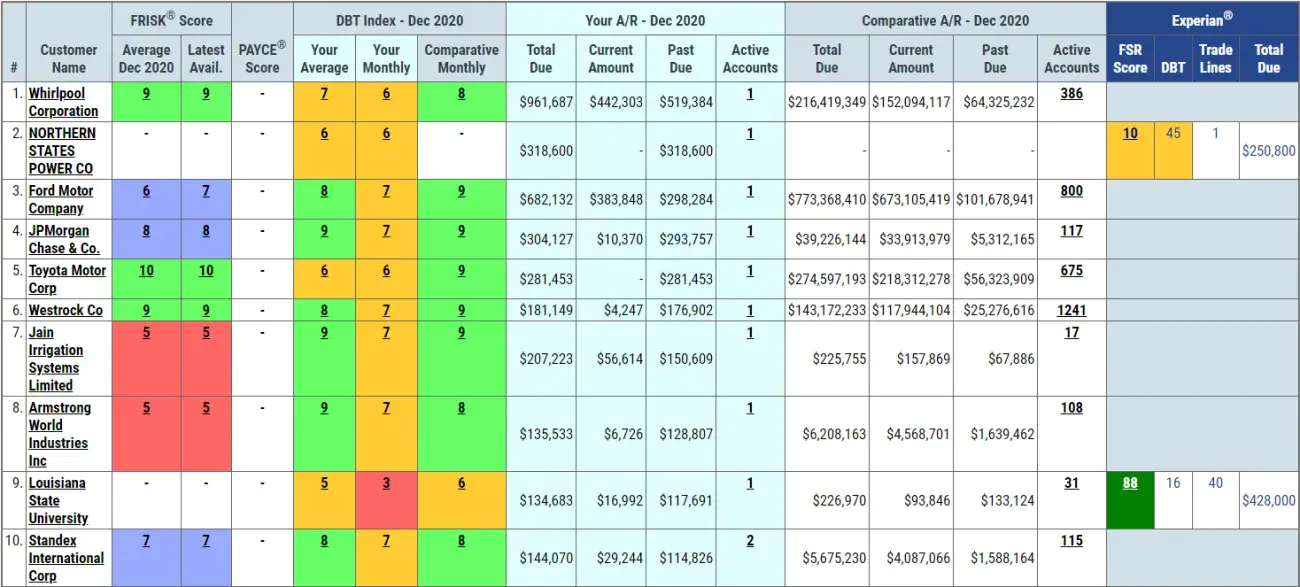
The Hidden Slow Payers report, in a similar display, reveals customers that are paying you on time but are paying other contributors slowly. In this next example report, observe the difference between “your monthly” DBT Index and “comparative monthly” DBT Index. This information can prove to be invaluable in your attempt to identify risky customers.
CreditRiskMonitor® also provides a variety of notifications to users and among them, bankruptcy alerts are frequently considered to be the most valuable. Another major benefit of the service are Experian’s Financial Stability Risk (FSR) scoreSM, which cover millions of private companies.
Bottom Line
CreditRiskMonitor®’s proprietary risk models, including the FRISK® score and PAYCE® score, offer industry-leading accuracy in the credit reporting arena to customers. We provide comprehensive coverage to all receivable portfolios submitted by Trade Contributors, and therefore support them in making more effective decisions to benefit their company. We receive ~$3 trillion in trade data annually through our platform and it continues to grow rapidly. Accomplish more with our free and easy-to-use service – there’s never been a better time to become a Trade Contributor.