Drilling for oil and natural gas has always been a highly volatile business, with often swift and material swings in the prices of these commodities making for exciting boom and bust cycles. The recent price war between OPEC and Russia is a shocking example of the downside risk, which can be quite painful and frequently push financially weak public companies into bankruptcy court. Sometimes more than once.
Here's a list of the 10 largest energy industry failures since 2013, as well as some of the riskiest companies that CreditRiskMonitor covers today. These companies should be watched closely as the current oil and natural gas price cycle continues to run its course.
CreditRiskMonitor is a leading web-based financial risk analysis and news service designed for credit, supply chain and other risk professionals. Subscribers include nearly 40% of the Fortune 1000 as well as many other large corporations worldwide. Important features of the service include:
- The FRISK® score, which is 96%-accurate in predicting public company failure risk
- Public company coverage of more than 56,000 across the globe
- Peer analysis to source alternative customers and suppliers
Ups and Downs
Higher oil and natural gas prices lead to increasing drilling activity, with at least a few companies overleveraging themselves in the industry-wide effort to drill while the money is good. Eventually, supply exceeds demand and energy prices fall, often precipitously. Drillers pull back, clearing the way for the next upcycle.
The downturn, however, often leads financially aggressive drillers into bankruptcy court, as they realize that they can't afford to carry the debt added to their balance sheets during the period of speculative excess.
There have been multiple bull and bear markets since a deep downturn started in mid-2014, when oil fell from over $100 a barrel to around $30. In recent years, though, prices hovered in the $50 range, which doesn't leave much room for drillers to turn a profit. Many drillers, notably smaller U.S. frackers, were limping along with debt-heavy balance sheets, hoping to stick around long enough to see a sustained oil rally. The ability to quickly ramp up unconventional onshore U.S. drilling activity, however, had been placing an upper bound on prices as U.S. drilling picked up with every oil rally. That's largely why OPEC and Russia have taken the gloves off in an attempt to push excess U.S. oil supply out of the market. With oil prices back in the $30 range, thanks to OPEC and Russia, times look set to get much tougher for the energy industry. It has been even worse in the natural gas space, where increased production and a supply glut has led to near decade-low prices.
Already, many once proud companies have been forced to seek out bankruptcy protection in recent years. Here are 10 of the largest:
Company | Bankruptcy Year | Total Assets (in Billions) | Country | Industry Subsector |
Seadrill Limited | 2017 | $21.666 | U.S.A. | Energy Services |
Linn Energy, Inc. | 2016 | $9.928 | U.S.A. | Oil and Gas Exploration |
OSX BRASIL SA | 2013 | R$ 9.799 | Brazil | Energy Services |
McDermott International Inc. | 2020 | $9.440 | U.S.A. | Energy Services |
Weatherford International plc | 2019 | $6.601 | U.S.A. | Energy Services |
Pacific Drilling SA | 2017 | $5.998 | Luxembourg | Energy Services |
Samson Resources Corporation | 2015 | $5.608 | U.S.A. | Oil and Gas Exploration |
CGG SA | 2017 | $4.861 | France | Energy Services |
Maverick Natural Resources, LLC | 2016 | $4.835 | U.S.A. | Oil and Gas Exploration |
Energy XXI Ltd | 2016 | $4.690 | U.S.A. | Oil and Gas Exploration |
There is a ripple effect here that shows up in the table above. Oil and gas exploration companies pulling back means reduced demand for energy services companies. These firms generally own large and expensive equipment typically financed with debt. So when oil and gas companies suffer, oil services companies often end up hurting exponentially more. In fact, six of the 10 largest bankruptcies above are energy services companies that got hit hard when demand from oil companies pulled back and they could no longer service their debt.
There are lessons to be learned from examining situations like these, which is why CreditRiskMonitor has an entire series of case studies dedicated to dissecting bankruptcy. We highlight the warning signs that existed in advance of the filing so subscribers can avoid being hit by similar situations in the future. These lessons are more important now than ever, with oil again well below the levels needed for most U.S. unconventional drillers to stay in the black.
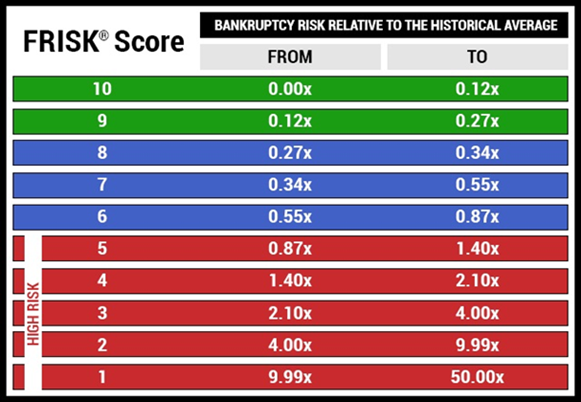
One of the most reliable bankruptcy warning signs is the 96% accurate FRISK® score. This score is the core of the CreditRiskMonitor service, bringing together multiple variables (financial ratios, market sentiment, credit agency ratings, and the crowdsourced research behavior of CreditRiskMonitor subscribers) into one simple-to-use tool. We simplify the review process by providing a "1" (highest risk)-to-"10" (lowest risk) scale, where any company that has a FRISK® score of "5" or lower should be closely monitored. A score of "1" indicates a 10-to-50 times higher than average probability of bankruptcy over the coming 12 months.
The highly accurate insights available from the FRISK® score, and all of the other valuable tools, are used by sophisticated risk professionals from nearly 40% of the Fortune 1000 and thousands of other companies worldwide.
Three Bankruptcy Examples
In the 18 months leading up to McDermott International's January 2020 bankruptcy, its FRISK® score fell from a middling "6" to a worst-possible "1." It was at that lowest level for at least five months before it finally declared bankruptcy. From summer through fall, into the dead of winter in the U.S. Throughout that entire time, though, this energy services company maintained a solid payment history, as measured by the DBT Index (using a "1" [worst]-to-"10" [best] scale). CreditRiskMonitor's DBT Index measures payment activity similar to Dun & Bradstreet’s PAYDEX® score. This divergence is called the "cloaking effect," and is why payment performance is misleading for gauging public company financial risk.
Other noteworthy signs of trouble included negative tangible net worth, weak interest coverage, net losses, and negative cash flow. In 2019, by the September quarter’s end, a covenant breach led to 100% of the company's debt being classified as short term, a common warning sign of financial distress. In addition to these trends, the news flow out of McDermott International was troubling, as well, including missing guidance, the departure of key personnel, and the hiring of turnaround advisors. As outlined in CreditRiskMonitor's McDermott International Bankruptcy Case Study, all of this information was available through the CreditRiskMonitor service well in advance of the company's bankruptcy filing.
Another energy services company, Weatherford International's FRISK® score had been hovering low in the "1"-to-"3" range for nearly two years before it finally declared bankruptcy in July 2019. Like McDermott International and many other public companies that eventually seek out court protections, it was paying its bills in a reasonably timely fashion prior to declaring. The FRISK® score, however, highlighted the underlying risks. CreditRiskMonitor subscribers knew to look deeper into what was going on at the company.
The observable problems included ongoing losses, weak interest coverage, and negative free cash flow. Heavy and increasing leverage was also an issue, as was a swift increase in the percentage of Weatherford International's debt that was classified as short-term. Like McDermott International, the news flow from Weatherford was also troubling as it worked its way toward bankruptcy. All of these warning signs were available in the CreditRiskMonitor service, as highlighted in the Weatherford International Bankruptcy Case Study.
Shifting to an energy driller, Linn Energy's story isn't all that much different. The company had a solid FRISK® score of "6" at the end of 2014 while it was still benefiting from lofty oil prices, but saw that steadily decline to a "1" by May 2015. High leverage, low working capital, and declining operating profits all helped drive the company’s FRISK® score lower. It eventually filed for bankruptcy in May 2016 with CreditRiskMonitor subscribers receiving ample early warning.
Some of the big news items along the way included a credit rating downgrade in August 2015 and operating income turning negative in November 2015. Both of these events were shown in the news feed on the company within the CreditRiskMonitor service. FRISK® score declines, meanwhile, are emailed directly to subscribers who have the company in their portfolio. Pushing important information out to subscribers so they are always aware of red flags is a key feature of the CreditRiskMonitor service.
Looking to the Future
This quick history lesson is important because it helps to identify some of the things you'll want to look at as you prepare for future bankruptcies. The most important takeaway is the dichotomy between the highly accurate FRISK® score and payment history which often fails to show the true risk of bankruptcy in public companies.
CreditRiskMonitor not only makes digging in easier, but it also pushes important updates including key news alerts, earnings releases, credit rating agency changes, and notable declines in the FRISK® score.
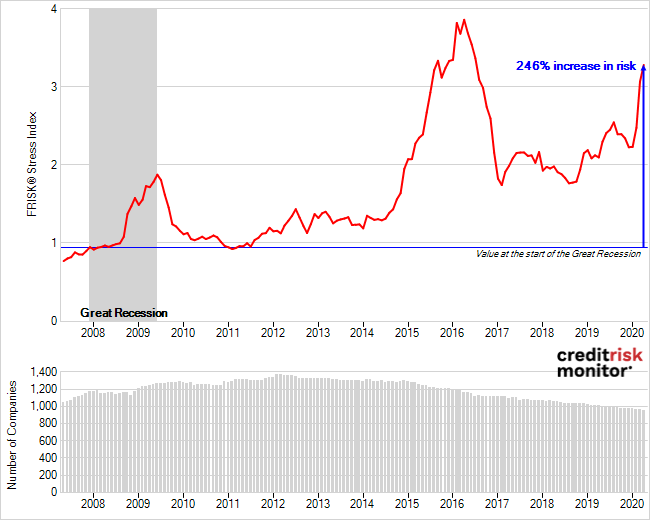
FRISK® scores throughout the Oil and Gas Extraction industry, as noted in the FRISK® Stress Index chart below (SIC 13), are deteriorating. The FRISK® Stress Index measures the aggregation of financial stress across groups of public companies and can be looked at by industry, across a subscriber's entire portfolio, or customized to examine a specific group of public companies. Below is the global Oil and Gas Extraction industry, which has seen bankruptcy risk increase nearly 250% above the levels that existed prior to the last recession. With oil prices weak today, hit by a mix of oversupply, the OPEC/Russia oil battle, and COVID-19 demand concerns, times are extremely difficult for companies in the energy patch.
In a cyclical industry like oil and natural gas drilling, it isn't a matter of if more companies will go bankrupt, but when. You'll want to make sure you have the most timely and accurate model at your disposal to stay ahead of such risks. With the downturn in full swing, however, here are three energy companies that are at a high risk of declaring bankruptcy within the next year. Notice the prompt payment histories, as indicated by the DBT Index despite the elevated financial risks.
Company | FRISK® score | DBT Index | Country | Subsector | Risk Factors |
Chesapeake Energy Corporation | 1 | 9 | U.S.A. | Oil and Gas Exploration |
|
Basic Energy Services, Inc. | 1 | 8 | U.S.A. | Energy Services |
|
Calfrac Well Services Ltd. | 1 | 9 | Canada | Oil and Gas Exploration |
|
Bottom Line
If you are watching the energy industry and looking to identify the highest-risk names in the space, CreditRiskMonitor's tools, including the 96%-accurate FRISK® score, can help. Contact us today for a free demonstration of all the tools we offer. We're happy to discuss the three high-risk names noted here, or any other companies that you desire.